
Hastings Planning Strategy Proposed Submission Version
Appendix 2: Hastings Borough Council Housing Trajectory 2011-2028
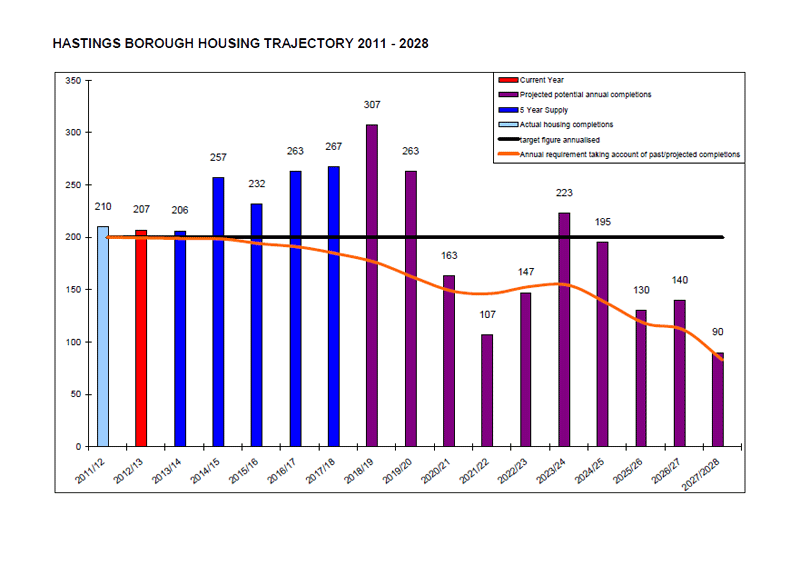
Figure 12: Housing trajectory graph
Housing Trajectory
The housing trajectory 2011 to 2028 shows past annual dwelling completions and projected annual completions in Hastings against a housing requirement of 3,400 dwellings. It examines, on an annual basis, how many additional dwellings will be needed at any one point in time to meet the housing requirements remaining over the period of the Plan. The current trajectory represents the housing land supply position as at 1 April 2012.
The forward looking element of the graph, takes account of the potential supply of housing arising from sites where construction activity is on-going, those with a current planning permission, sites that are allocated in the adopted Hastings Local Plan 2004 and unallocated sites that have the potential to contribute to housing delivery.
The data that underpins the trajectory is based on the Strategic housing Land Availability Assessment, and also reflects the latest information gathered from housing developers and land owners regarding build rates and disposal plans.
The trajectory will be updated annually in the Council’s Annual Monitoring Report.
Local Planning Authorities (LPAs) have to ensure they have a continuous five year supply of deliverable sites available for housing development. National guidance requires that the 5-year supply should include an additional allowance of plus 20%. The five year period starts after the current monitoring year, 2012/2013, and should include the net additional dwellings expected to come forward from ready to develop sites.
Critically, in order for sites to be considered deliverable and included in the 5 year supply, sites should be:
- Available – the site is available for development now
- Suitable - the site offers a suitable location for development and would contribute to the creation of sustainable, mixed communities
- Achievable - there is a reasonable prospect that housing will be delivered on the site within 5 years
In compiling 5-year supply figure, all sites have been assessed against these three factors.
The table below shows how the 5-year supply is calculated
| Housing Target | 3,400 |
|---|---|
| Residual target (after deducting 417 completions in 2011/12 & 2012/13) | 2,983 |
| Annual residual target (residual divided by 15 years 2013/14 – 2027/28 | 199 |
| 5-year target (annual residual x 5 years + 20%) | 1,194 |
| 5-year housing land supply 2012/13 – 2016/17 | 1,225 |
| 5-year supply of housing expressed as a % | 102.6% |
| Number of years of housing land supply | 6.2 |
Table 10: Calculating 5-year housing land supply
The current assessment of sites shows that in terms of a five year supply, there is the potential for some 1,323 dwellings to come forward in this period. This is in excess of the target number 1,225 and is equivalent to 6.2 years of supply.